5 Fundamentals to Risk Scoring for Your Project
The purpose of this blog post is to cover how to do risk scoring, which is creating a numerical rating for risks.
Risks are under the LEAD domain and the Motive segment in the MPM model.
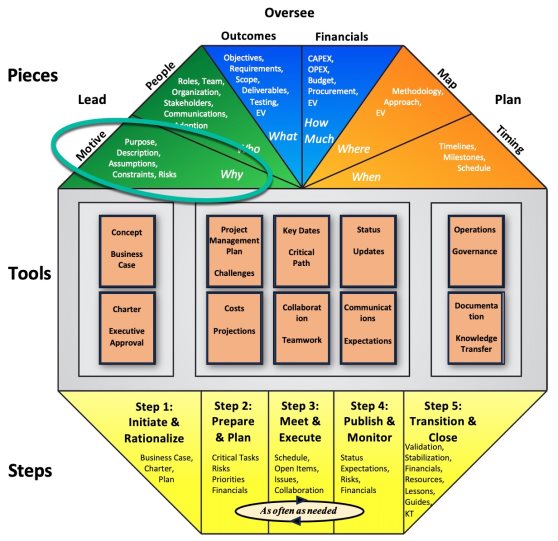
Risks are under the LEAD domain and the Motive segment in the MPM model
Numerical Risk Rating
A numerical value can be assigned to each project risk and then the risks can be sorted so that those with the highest value are on the top.
The purpose of this is an attempt to objectively quantify the most important risks and therefore create a focus for those items which could have the most impact.
Risk scoring is an attempt to quantify risk severity
Across the over 30 different clients for which I have managed projects, there have been several ways to do the calculation, but there are some fundamentals that are common.
There are key fundamentals with some variances
There are a number of variances to this approach, but the key fundamentals are as follows:
- Risk description
- The risk is identified as either a simple statement of the issue, or it can be more comprehensive and be a statement that explains the risk in three parts: 1. an issue, that can 2. cause a problem, that can 3. lead to an impact. This statement is covered in this blog post.
- Probability
- The probability is the likelihood of the risk happening.
- This is the first numerical value. In the chart below it is listed as a 1, 2, or 3, with 1 being the lowest and 3 being the highest.
- The variance I have seen is in the values of the numbers, so some have used 1, 3, 5, again with 1 being lowest and 5 being highest.
- I have also seen a variance where it was expanded from three numbers to 5 or more, which is just additional levels of granularity.
- Impact
- This is a measure of the severity of the impact on the project or the organization if it occurs.
- As above it is listed as 1, 2, or 3, with 1 having the least amount of impact and 5 having the greatest.
- Usually, it is interpreted as: anything with a 1 has a more localized effect, whereas 3 has an organization-wide effect.
- If it is a financial impact, then 1 is a lower dollar impact and 3 is a greater financial impact.
- As with probability the variance I have seen is in the values of the numbers and also the number of values in the range.
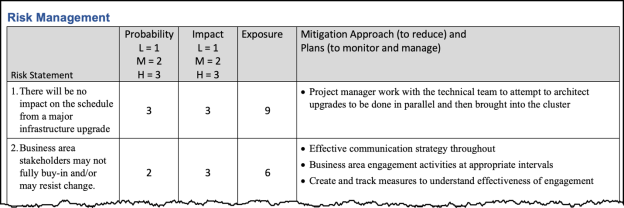
Risk scoring table
- Exposure
- The exposure is the result of multiplying the two values together.
- The table is then sorted from largest to smallest.
- The greatest values at the top are then expected to indicate those risks which need additional attention.
- Mitigation
- The mitigation outlines the steps that can be taken in an attempt to minimize the risk
- Mitigation can also list the steps that can be taken to monitor and manage the risk if it occurs.
Risk Scoring in Practice
The table of scored risks can be beneficial to ensuring the greatest risks are at the top and involve the most discussion and attention.
The table of scored risks is often seen as a way to quantify risks so they can be analyzed objectively.
In experience you probably find, as I did, that even if you put them in a table, the fact that they are in the table means they get attention and review.
Everything in the table is reviewed regardless of the rating. By that I mean, if you were to walk through the table with stakeholders, it’s not as if you get to a certain numerical value and then collectively decide to stop reviewing the risks.
All risks in the table are reviewed. So, the greatest benefit comes not in determining whether something has an exposure value of 9 versus 6, as in the example table above, but rather that it is in the table and therefore it should have discussion and observation.
Summary
Risk scoring is the process of listing risks in a table and then using a low to high scoring to attach values to both the probability and impact with a resulting amount indicating the exposure or severity of the risk to the project or organization.
Steps to mitigate the outcome of the risks are added in a final column on the table.
The table is sorted from high to low exposure to provide those risks with the greatest severity the most attention and observation.
The risk scoring can help ensure the most important risks have the most visibility. In practice all risks in the table are reviewed and discussed to ensure the project and organization are aware and prepared.
Action Steps / Apply This Knowledge
- Create a table like the one above and identify three risks for your project and add the risks statement as an issue or as a statement of issue+problem+impact.
- Add steps for mitigation.
- Assign numbers for the probability and impact of each risk and multiply the values to get the exposure or severity.
- Sort the risk table from highest to lowest and see if reading through the table it makes sense that the most severe risk is on the top. Think through the numbers in the table from the perspective of each of your key stakeholders.
- Prompt engineering guidance for AI GPTs such as chatGPT: “I’m a business leader launching a project whose purpose is Y, and it’s delivering X. What are some different ways to do risk scoring that I could consider to include in my charter?”
Learn More to Do More
Business evolves through change initiatives otherwise known as projects. The key to managing these change initiatives so you have more time, and less stress is to use simple strategies and tools.
Check out the Learning Hub’s other Articles with Actionable Steps, organized with a busy leader in mind, by topic or main idea, and with some AI GPT (e.g. ChatGPT) prompt engineering suggestions under the Action steps: https://simplepmstrategies.com/learning-hub-index
LEAD – Risk Scoring
© Simple PM Strategies 2024